By accounting for both known and unknowable factors, managers can identify salespeople with traits that work best in different types of sales. Getty Images

When you're a manager, decisions barrage you each day. What product works? Which store layout entices? How will you balance the budget? Many of these decisions ultimately hinge on one factor: the skills of your sales force.

Often, when managers evaluate their salespeople they contend with invisible factors that may not show up in commissions or name-tagged sales rosters — intangibles such as product placement, season or simply a store's surrounding population. This makes it hard to fully evaluate a salesperson, or to spot which workers can teach valuable skills to their peers and improve the whole team.

But what if you could plug a few variables into a statistical model to spot your best sellers? You could then ask the star salespeople to teach coworkers some of their secrets. New research by Rice Business professor Wagner A. Kamakura and colleague Danny P. Claro of Brazil's Insper Education and Research Institute offers a technique for doing this. Blending statistical methods that incorporate both known and unknown factors, Kamakura and Claro developed a practical tool that, for the first time, allows managers to identify staffers with key hidden skills.

To test their model, the researchers analyzed store data from 35 cosmetic and healthcare retail franchises in four South American markets. These particular stores were ideal to test the model because their salespeople were individually responsible for each transaction from the moment a customer entered a store to the time of purchase. The salespeople were also required to have detailed knowledge of products throughout each store.

Breaking down the product lines into 11 specific categories, and accounting for predictors such as commission, product display, time of year and market potential, Kamakura and Claro documented and compared each salesperson's performance across products and over time.

They then organized members of the salesforce by strengths and weaknesses, spotlighting those workers who used best practices in a certain area and those who might benefit from that savvy. The resulting insight allowed managers to name team members as either growth advisors or learners. Thanks to the model's detail, Kamakura and Claro note, managers can spot a salesperson who excels in one category but has room to learn, rather than seeing that worker averaged into a single, middle-of-the-pack ranking.

If a salesperson is, for example, a sales savant but lags in customer service, managers can use that insight to help the worker improve individually, while at the same time strategizing for the store's overall success. Put into practice, the model also allows managers to identify team members who excel at selling one specific product category — and encourage them to share their secrets and methods with coworkers.

It might seem that teaching one employee to sell one more set of earbuds or one more lawn chair makes little difference. But applied consistently over time, such personalized product-specific improvement can change the face of a salesforce — and in the end, a whole business. A good manager uses all the tools available. Kamakura and Claro's model makes it possible for every employee on a sales team to be a potential coach for the rest.

------

This story originally ran on Rice Business Wisdom.

Based on research from Wagner A. Kamakura, the Jesse H. Jones Professor of Marketing at Jones Graduate School of Business at Rice University.
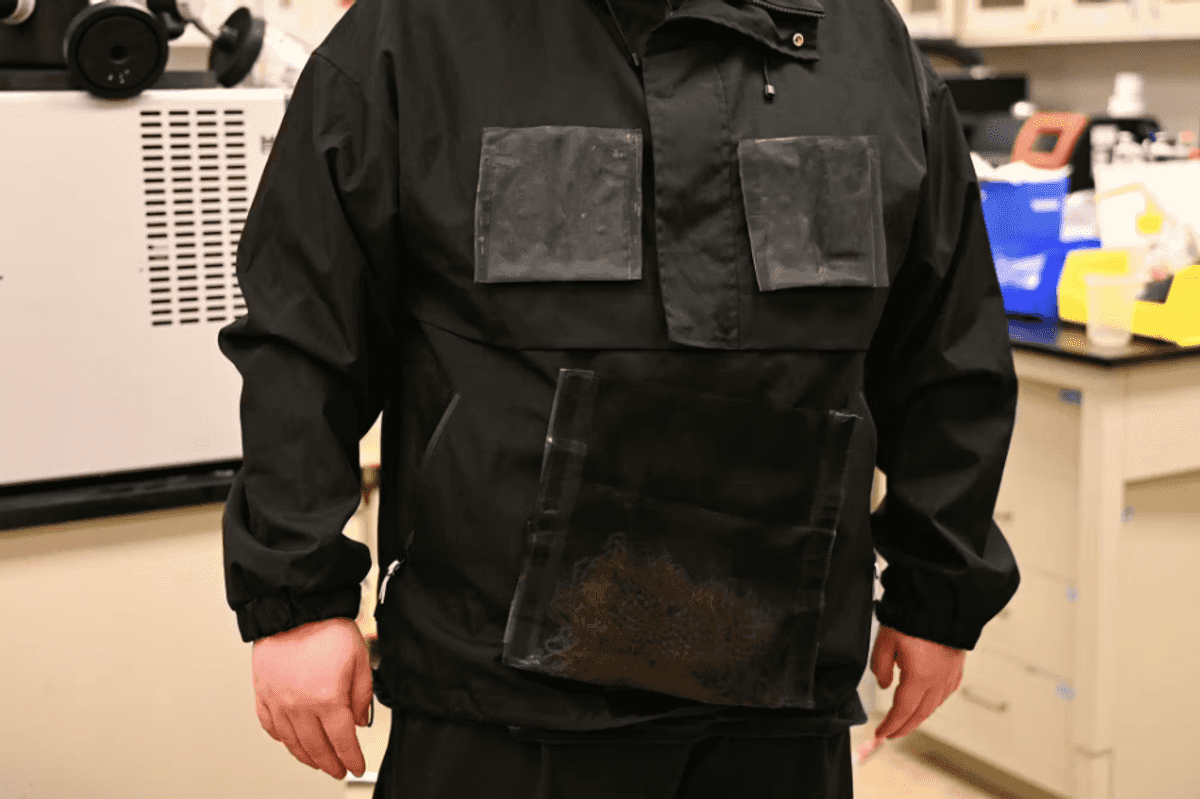
Keeping on track with trends is crucial to growing and developing a relationship with your customers, these Rice University researchers found. Getty Images

Rice researcher delves into the importance of trendspotting in consumer behavior

Houston voices

Every business wants to read consumers' minds: what they love, what they hate. Even more, businesses crave to know about mass trends before they're visible to the naked eye.

In the past, analysts searching for trends needed to pore over a vast range of sources for marketplace indicators. The internet and social media have changed that: marketers now have access to an avalanche of real-time indicators, laden with details about the wishes hidden within customers' hearts and minds. With services such as Trendistic (which tracks individual Twitter terms), Google Insights for Search and BlogPulse, modern marketers are even privy to the real-time conversations surrounding consumers' desires.

Now, imagine being able to analyze all this data across large panels of time – then distilling it so well that you could identify marketing trends quickly, accurately and quantitatively.

Rice Business professor Wagner A. Kamakura and Rex Y. Du of the University of Houston set out to create a model that makes this possible. Because both quantitative and qualitative trendspotting are exploratory endeavors, Kamakura notes, both types of research can yield results that are broad but also inaccurate. To remedy this, Kamakura and Du devised a new model for quickly and accurately refining market data into trend patterns.

Kamakura and Du's model entails taking five simple steps to analyze gathered data using a quantitative method. By following this process of refining the data tens or hundreds of times, then isolating the information into specific seasonal and non-seasonal trends or dynamic trends, researchers can generate steady trend patterns across time panels.

Here's the process:

  • First, gather individual indicators by assembling data from different sources, with the understanding that the information is interconnected. It's crucial to select the data methodically, rather than making random choices, in order to avoid subjectively preselecting irrelevant indicators and blocking out relevant ones. Done sloppily, this first step can generate misleading information.
  • Distill the data into a few common factors. The raw data might include inaccuracies, which must be filtered out to lower the risk of overreacting or noting erroneous indicators.
  • Interpret and identify common trends by understanding the causes of spikes or dips in consumer behavior. It's key to separate non-cyclical and cyclical changes, because exterior events such as holidays or weather can alter behavior.
  • Compare your analysis with previously identified trends and other variables to establish their validity and generate insights. Looking at past performance through the filter of new insights can offer managers important guidance.
  • Project the trend lines you've identified using historical tracking data and their modeling framework. These trend lines can then be extrapolated into near-future projections, allowing managers to better position themselves and be proactive trying to reverse unfavorable trends and leverage positive ones.

It's important to bear in mind that the indicators used for quantitative trendspotting are prone to random and systematic errors, Kamakura writes. The model he devised, however, can filter these errors because it keeps them from appearing across different series of time panels. The result: better ability to identify genuine movements and general trends, free from the influence of seasonal events and from random error.

It goes without saying that the information and persuasiveness offered by the internet are inevitably attended by noise. For marketers, this means that without filtering, some trends show spikes for temporary items – mere viral jolts that can skew market research.

Kamakura and Du's model helps sidestep this problem by blending available historical data analysis, large time panels and movements while avoiding errors common to more traditional methods. For managers longing to glimpse the next big thing, this analytical model can reveal emerging consumer movements with clarity – just as they're becoming the future.

(For the mathematically inclined, and those comfortable with Excel macros and Add-Ins, who want to try trendspotting on their own tracking data, Kamakura's Analytical Tools for Excel (KATE) can be downloaded for free at http://wak2.web.rice.edu/bio/Kamakura_Analytic_Tools.html.)

------

This article originally appeared on Rice Business Wisdom.

Wagner A. Kamakura is Jesse H. Jones Professor of Marketing at Jones Graduate School of Business at Rice University.

Ad Placement 300x100
Ad Placement 300x600

CultureMap Emails are Awesome

How Houston innovators played a role in the historic Artemis II splashdown

safe landing

Research from Rice University played a critical role in the safe return of U.S. astronauts aboard NASA’s Artemis II mission this month.

Rice mechanical engineer Tayfun E. Tezduyar and longtime collaborator Kenji Takizawa developed a key computational parachute fluid-structure interaction (FSI) analysis system that proved vital in NASA’s Orion capsule’s descent into the Pacific Ocean. The FSI system, originally developed in 2013 alongside NASA Johnson Space Center, was critical in Orion’s three-parachute design, which slowed the capsule as it returned to Earth, according to Rice.

The model helped ensure that the parachute design was large enough to slow the capsule for a safe landing while also being stable enough to prevent the capsule from oscillating as it descended.

“You cannot separate the aerodynamics from the structural dynamics,” Tezduyar said in a news release. “They influence each other continuously and even more so for large spacecraft parachutes, so the analysis must capture that interaction in a robustly coupled way.”

The end result was a final parachute system, refined through NASA drop tests and Rice’s computational FSI analysis, that eliminated fluctuations and produced a stable descent profile.

Apart from the dynamic challenges in design, modeling Orion’s parachutes also required solving complex equations that considered airflow and fabric deformation and accounted for features like ringsail canopy construction and aerodynamic interactions among multiple parachutes in a cluster.

“Essentially, my entire group was dedicated to that work, because I considered it a national priority,” Tezduyar added in the release. “Kenji and I were personally involved in every computer simulation. Some of the best graduate students and research associates I met in my career worked on the project, creating unique, first-of-its-kind parachute computer simulations, one after the other.”

Current Intuitive Machines engineer Mario Romero also worked on Orion during his time at NASA. From 2018 to 2021, Romero was a member of the Orion Crew Capsule Recovery Team, which focused on creating likely scenarios that crewmembers could encounter in Orion.

The team trained in NASA’s 6.2-million-gallon pool, using wave machines to replicate a range of sea conditions. They also simulated worst-case scenarios by cutting the lights, blasting high-powered fans and tipping a mock capsule to mimic distress situations. In some drills, mock crew members were treated as “injured,” requiring the team to practice safe, controlled egress procedures.

“It’s hard to find the appropriate descriptors that can fully encapsulate the feeling of getting to witness all the work we, and everyone else, did being put into action,” Romero tells InnovationMap. “I loved seeing the reactions of everyone, but especially of the Houston communities—that brought me a real sense of gratitude and joy.”

Intuitive Machines was also selected to support the Artemis II mission using its Space Data Network and ground station infrastructure. The company monitored radio signals sent from the Orion spacecraft and used Doppler measurements to help determine the spacecraft's precise position and speed.

Tim Crain, Chief Technology Officer at Intuitive Machines, wrote about the experience last week.

"I specialized in orbital mechanics and deep space navigation in graduate school,” Crain shared. “But seeing the theory behind tracking spacecraft come to life as they thread through planetary gravity fields on ultra-precise trajectories still seems like magic."

UH breakthrough moves superconductivity closer to real-world use

Energy Breakthrough

University of Houston researchers have set a new benchmark in the field of superconductivity.

Researchers from the UH physics department and the Texas Center for Superconductivity (TcSUH) have broken the transition temperature record for superconductivity at ambient pressure. The accomplishment could lead to more efficient ways to generate, transmit and store energy, which researchers believe could improve power grids, medical technologies and energy systems by enabling electricity to flow without resistance, according to a release from UH.

To break the record, UH researchers achieved a transition temperature 151 Kelvin, which is the highest ever recorded at ambient pressure since the discovery of superconductivity in 1911.

The transition temperature represents the point just before a material becomes superconducting, where electricity can flow through it without resistance. Scientists have been working for decades to push transition temperature closer to room temperature, which would make superconducting technologies more practical and affordable.

Currently, most superconductors must be cooled to extremely low temperatures, making them more expensive and difficult to operate.

UH physicists Ching-Wu Chu and Liangzi Deng published the research in the Proceedings of the National Academy of Sciences earlier this month. It was funded by Intellectual Ventures and the state of Texas via TcSUH and other foundations. Chu, founding director and chief scientist at TcSUH, previously made the breakthrough discovery that the material YBCO reaches superconductivity at minus 93 K in 1987. This helped begin a global competition to develop high-temperature superconductors.

“Transmitting electricity in the grid loses about 8% of the electricity,” Chu, who’s also a professor of physics at UH and the paper’s senior author, said in a news release. “If we conserve that energy, that’s billions of dollars of savings and it also saves us lots of effort and reduces environmental impacts.”

Chu and his team used a technique known as pressure quenching, which has been adapted from techniques used to create diamonds. With pressure quenching, researchers first apply intense pressure to the material to enhance its superconducting properties and raise its transition temperature.

Next, researchers are targeting ambient-pressure, room-temperature superconductivity of around 300 K. In a companion PNAS paper, Chu and Deng point to pressure quenching as a promising approach to help bridge the gap between current results and that goal.

“Room-temperature superconductivity has been seen as a ‘holy grail’ by scientists for over a century,” Rohit Prasankumar, director of superconductivity research at Intellectual Ventures, said in the release. “The UH team’s result shows that this goal is closer than ever before. However, the distance between the new record set in this study and room temperature is still about 140 C. Closing this gap will require concerted, intentional efforts by the broader scientific community, including materials scientists, chemists, and engineers, as well as physicists.”

---

This article originally appeared on EnergyCapitalHTX.com.