

As a researcher, what is more important to you than a record of your research and scholarship? A Digital Persistent Identifier, or DPI, distinguishes you and your work from that of your peers. Graphic by Miguel Tovar/University of Houston

Every researcher needs a Digital Persistent Identifier.

As a researcher, what is more important to you than a record of your research and scholarship? A Digital Persistent Identifier, or DPI, distinguishes you and your work from that of your peers – and having one will be mandated for those receiving federal funding. Let’s take a deeper look at why this number is so important. We’ll also compare the different platforms— ORCID, Web of Science, Scopus and Google Scholar — so that you can be sure your publications, presentations, peer reviews and even information about who is citing you are being properly stored and accessed.

ORCID

There are many types of profiles and DPIs that can meet your needs, but there’s no silver bullet. Placing your work onto multiple platforms is necessary according to Andrea Malone, Research Visibility and Impact Coordinator at UH Libraries. She cautions researchers to “be realistic about how many identifiers you can maintain.”

The most popular is ORCID, which stands for Open Researcher and Contributor ID. It’s free to set up, and there is no chance of accidentally or on-purpose having multiple ORCID accounts – it’s assigned to you like a social security number and follows you, the researcher. This comes in particularly especially handy for researchers with common names.

An identifier is federally mandated for those receiving governmental funds. It is not specified that ORCID must be that identifier. For example, according to Malone: “a Web of Science profile also assigns an identifier, which would also satisfy the mandate.” But most researchers choose ORCID because it’s publicly available with no access restrictions.

While an ORCID number is free for researchers, there is a subscription fee for an institution to be associated with ORCID. Information will not pre-populate in an ORCID profile and it doesn’t track citation counts – it only shows what you put in. There are, however, linking wizards that allow you to link from Web of Science and Scopus to your ORCID account. If you choose this option, citations will automatically populate in your ORCID profile. It’s up to the researcher to doublecheck to be sure the information has automated, however.

Google Scholar

Google Scholar is a profile, not an identifier, so it does not comply with federal funding requirements. It is free, however, and it pulls from the open web. You can choose to have your list of articles updated automatically, review the updates yourself or manually update your articles at any time. Google Scholar also specifies which articles are open access. A PDF or HTML icon will appear on the righthand side of each citation for one to download articles.

Web of Science Vs. Scopus

Scopus is known for covering more journals and a wider range of metrics to evaluate research impact than Web of Science. Different platforms are a go-to for certain disciplines – for example, Web of Science is usually associated with hard sciences, although investigators in the social sciences and humanities also place their work on this platform from time to time. It’s a good idea to check out which platforms others in your discipline are using for their profiles.

Staying up-to-date

Of course, DPIs don’t work as intended unless researchers keep their profiles current. That means you need to check your profile after every publication and every time you switch to a new institution. Just as you would update your CV, you must update your ORCID or other DPI profile.

One tactic Malone suggests is setting a schedule either biweekly or monthly to check all your profiles. “One thing that’s helpful is that with all of them, you can set up alerts and create an alert as often as you want,” Malone goes on. “At that time, the program will scrawl the content within the source and alert you to anytime any of your publications appear in their database.”

The Big Idea

No one tool can paint a complete picture of all your scholarship. Be strategic and intentional about which platforms you use. Consider your audience, the platforms others in your discipline use and make sure you have an ORCID profile to comply with the federal mandate. But be careful not to sign up for more than you can feasibly maintain and keep current.

------

This article originally appeared on the University of Houston's The Big Idea. Sarah Hill, the author of this piece, is the communications manager for the UH Division of Research.

Ad Placement 300x100
Ad Placement 300x600

CultureMap Emails are Awesome

UH expands Medical Center footprint with $77M research facility

breaking ground

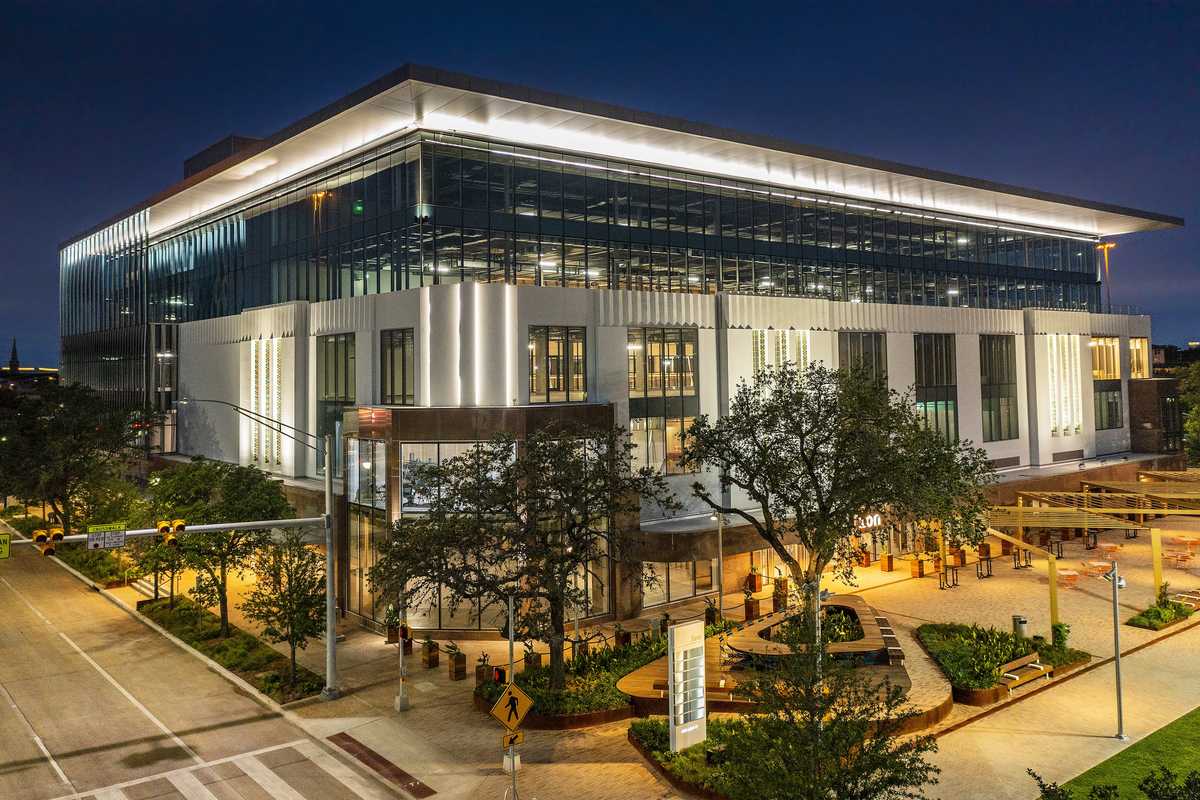
The University of Houston broke ground on a brand new $77.5 million Medical Research Building last week that will host clinical trials and a virtual reality behavioral health suite, among other laboratories. Designed by SmithGroup, it will be the second building on the UH Medical Center campus after the Fertitta College of Medicine opened in 2022.

“The Medical Research Building was designed to foster collaboration and discovery while creating a welcoming environment for students, researchers and the community,” Kalman Nagy, higher education studio design leader for SmithGroup, said in a news release. “As the second building on the University of Houston’s medical campus, we wanted to create a strong connection to the College of Medicine and the surrounding woodlands, with outdoor terraces, shared learning spaces and natural views that inspire interaction and innovation.”

Located just behind the Fertitta building at 5150 Medical Service Drive, the 57,000-square-foot building will house wet laboratories, computational research spaces and specialized facilities for clinical research. The virtual reality behavioral health suite will use immersive technology to deliver care through manufactured audio and visual environments. It’s part of the college’s vision for developing new medical advancements in the heart of Houston’s medical community. The groundbreaking comes on the heels of the launch of the university's cross-disciplinary academic venture, UH Health, this summer.

“This groundbreaking marks an important next step in the growth of the Fertitta College of Medicine and UH Health,” Dr. Jonathan McCullers, vice president for health affairs at UH, added in the release. “We are building the research capacity to match our ambitions—bringing together scientists, physicians and experts from across the University to accelerate discovery and turn promising ideas into solutions that improve people’s lives.”

UH’s journey to establish a significant presence alongside the University of Texas and Baylor in the Medical Center started in 2009 when it became an official full institutional member. The university launched its plans for the Fertitta building in 2013, and is pursuing Health Science Center designation from the Texas Legislature in the next year’s session.

“The research that will take place here will directly benefit our community,” UH President Renu Khator added. “Diseases do not recognize disciplinary silos, and neither should our research. This building will bring together experts from across UH to break down those barriers, work across disciplines and tackle some of our most complex health challenges.”

The building is slated to open in 2028.

Houston ranks among 15 U.S. hot spots for women in tech

Ranking It

Houston is soaring among the best places in the U.S. for women in tech, a new report says. Houston ranked No. 15 nationwide in SmartAsset's new report, "Best and Worst Cities for Women in Tech — 2026 Study," which compared the 50 biggest U.S. cities across four metrics:

  • Gender pay gap — women's median earnings as a percentage of men’s median earnings in tech
  • The share of all tech workers that are women
  • The overall concentration of employment for tech workers, defined as "tech workers as a share of the local workforce"
  • Women tech workers’ median earnings, adjusted for regional price parity
For the purpose of the study, tech workers are defined as "city residents employed in computer and mathematical occupations." The study's findings show that fewer than 9,500 tech workers in Houston are women, or 25.6 percent of the total tech workforce in the city. In total, tech workers in general make up less than 3 percent of the Houston workforce.Despite the high ranking, women tech workers in Houston have a sizeable gap to cross to receive equal pay compared to their male counterparts in the same industry. Women tech workers make just over $97,000 in median earnings after adjusting for regional price parity, which is only 93 percent of what male tech workers make, SmartAsset found.

There are only two U.S. cities where women in tech earn more than what their male counterparts: Miami and Memphis, Tennessee. Women tech workers in Miami make an adjusted $88,650 in median earnings, or 101.7 percent of what men in tech make. In Memphis, women make $84,718 in adjusted earnings, or 101.5 percent of what men in tech earn.

The findings also assert that women remain underrepresented in the nation's overall tech sector, despite making up nearly half of the total workforce. Only 22.6 percent of the country's tech labor force is made up of women, according to the Equal Employment Opportunity Commission."Opportunities for women in tech can vary considerably by location, and these differences shape access to jobs, career advancement and earning potential," the report's author wrote. "In some places, women account for a larger share of tech workers, face narrower pay gaps and enjoy a stronger local labor market. In others, they may encounter a more challenging career environmentThe six other Texas cities that earned spots in the report are Austin (No. 6), Fort Worth (No. 26), Dallas (No. 32), Arlington (No. 38), San Antonio (No. 42), and El Paso (No. 49).

The top 10 best U.S. cities for women in tech are:

  • No. 1 – San Jose, California
  • No. 2 – Seattle, Washington
  • No. 3 – San Francisco, California
  • No. 4 – Atlanta, Georgia
  • No. 5 – Baltimore, Maryland
  • No. 6 – Austin, Texas
  • No. 7 – Oakland, California
  • No. 8 – Portland, Oregon
  • No. 9 – Boston, Massachusetts
  • No. 10 – Minneapolis, Minnesota
---

This article first appeared on CultureMap.com.