Houston startups started 2026 strong, bringing in nearly $1 billion in venture capital in the first half of the year, Pitchbook data shows.
Here are 17 Houston companies that secured funding since January, according to reporting by InnovationMap and our sister site, EnergyCapitalHTX.com.
Did we miss a funding round? Let us know by emailing innoeditor@innovationmap.com.

Sage Geosystems raised a $97 million Series B. Photo via sagegeosystems.com.
Houston-based geothermal energy startup Sage Geosystems closed its Series B fundraising round in January and plans to use the money to launch its first commercial next-generation geothermal power generation facility.
Ormat Technologies and Carbon Direct Capital co-led the $97 million round, according to a press release from Sage. Existing investors Exa, Nabors, alfa8, Arch Meredith, Abilene Partners, Cubit Capital and Ignis H2 Energy also participated, as well as new investors SiteGround Capital and The UC Berkeley Foundation’s Climate Solutions Fund.
The new geothermal power generation facility will be located at one of Ormat Technologies' existing power plants. The Nevada-based company has geothermal power projects in the U.S. and numerous other countries around the world. The facility will use Sage’s proprietary pressure geothermal technology, which extracts geothermal heat energy from hot dry rock, an abundant geothermal resource. Continue reading.

Sandip Bordoloi and Sunny Zhang, founders of True Leap Inc. Photo via trueleapinc.com.
Houston-based edtech company TrueLeap Inc. closed an oversubscribed seed round in January.
The $3.3 million round was led by Joe Swinbank Family Limited Partnership, a venture capital firm based in Houston. Gamper Ventures, another Houston firm, also participated with additional strategic partners.
TrueLeap reports that the funding will support the large-scale rollout of its "edge AI, integrated learning systems and last-mile broadband across underserved communities." Continue reading.

Wellysis is known for its continuous ECG/EKG monitor with AI reporting, known as the S-Patch. Photo via wellysis.com.
Wellysis, a Seoul, South Korea-headquartered wearable biosensing company with its U.S. subsidiary based in Houston, closed a $13.5 million pre-IPO funding round in February and plans to expand its Texas operations.
The round was led by Korea Investment Partners, Kyobo Life Insurance, Kyobo Securities, Kolon Investment and a co-general partner fund backed by SBI Investment and Samsung Securities, according to a news release.
Wellysis reports that the latest round brings its total capital raised to about $30 million. The company is working toward a Korea Securities Dealers Automated Quotations listing in Q4 2026 or Q1 2027.
Wellysis is known for its continuous ECG/EKG monitor with AI reporting. Its lightweight and waterproof S-Patch cardiac monitor is designed for extended testing periods of up to 14 days on a single battery charge. Continue reading.

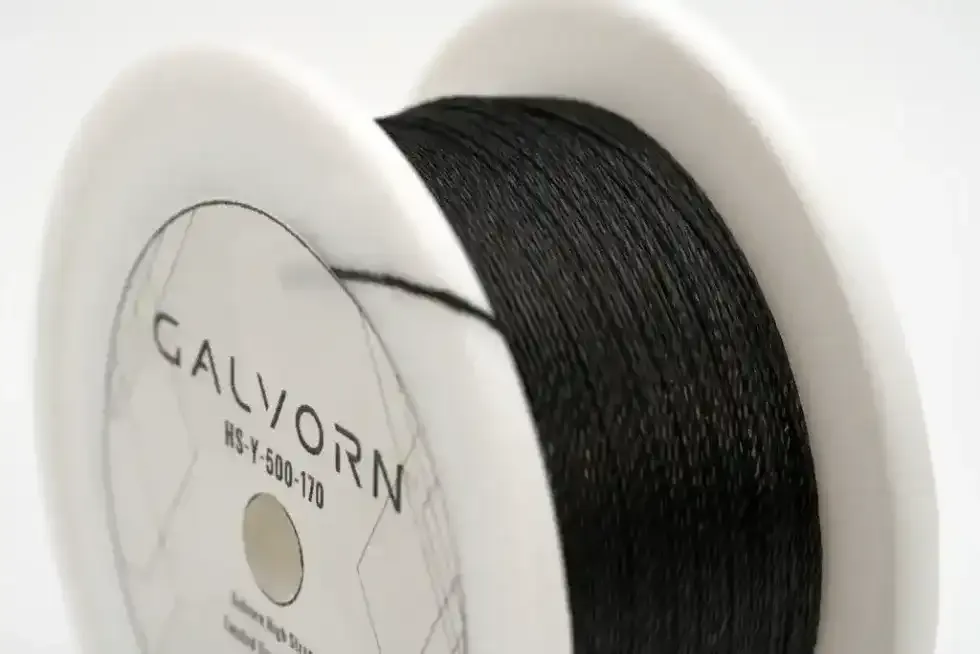
DexMat plans to use its seed funding to commercially scale Galvorn, its carbon-based conductive fiber. Photo courtesy DexMat
Houston-based material science and climatech startup DexMat closed a $5 million seed round in February.
The round was led by non sibi ventures, with participation from Governance Partners, Tailwind Futures, BetterWay, Capital Factory and other investors. The company additionally announced that it has secured $3 million of non-dilutive funding.
DexMat plans to use the recent round to commercially scale Galvorn, its carbon-based conductive fiber. The high-performance copper alternative, originally developed at Rice University, is made from carbon nanotube (CNT) fibers, which are less energy- and CO2-intensive to produce. Continue reading.
 Houston biotech co. raises $11M to advance ALS drug development
Coya Therapeutics plans to scale up manufacturing and prepare for the commercialization of COYA 302, its ALS therapy drug. Photo via Getty Images
Houston-based clinical-stage biotechnology company Coya Therapeutics (NASDAQ: COYA) closed a $11.1 million in a private investment round in February.
India-based pharmaceuticals company Dr. Reddy’s Laboratories Inc. led the round with a $10 million investment, according to a news release. New York-based investment firm Greenlight Capital, Coya’s largest institutional shareholder, contributed $1.1 million.
Coya reports that it plans to use the proceeds to scale up manufacturing of low-dose interleukin-2 (IL-2), which is a component of its COYA 302 and will support the commercial readiness of the drug. COYA 302 enhances anti-inflammatory T cell function and suppresses harmful immune activity for treatment of Amyotrophic Lateral Sclerosis (ALS), Frontotemporal Dementia (FTD), Parkinson’s disease and Alzheimer’s disease. Continue reading.

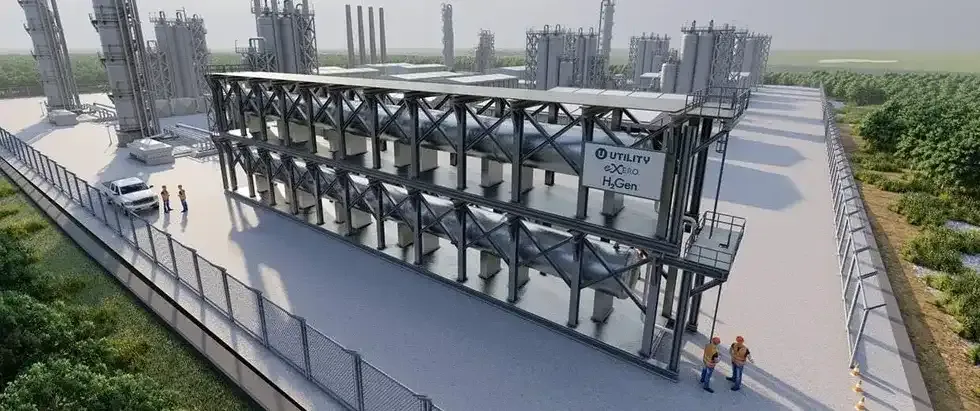
Utility Global’s H2Gen technology aims to decarbonize the heavy industrial sector. Photo courtesy of Utility Global
Houston-based Utility Global raised $100 million in an ongoing Series D round to globally deploy its decarbonization technology at an industrial scale, the company reported in February.
The round was led by Ara Partners and APG Asset, according to a news release. Utility plans to use the funding to expand manufacturing, grow its teams and support its commercial developments and partnerships.
Utility Global's H2Gen technology produces low-cost, clean hydrogen from water and industrial off-gases without requiring electricity. It's designed to integrate into existing industrial infrastructure in hard-to-abate assets in the steel, refining, petrochemical, chemical, low-carbon fuels, and upstream oil and gas sectors. Continue reading.

Cart.com raised $180 million to scale its logistics network, expand AI capabilities and develop workflow automation tools. Photo courtesy of Cart.com
Houston-based commerce and logistics platform Cart.com raised $180 million in growth capital from private equity firm Springcoast Partners, pushing the startup past the $1 billion funding mark since its founding in 2020, the company reported in March.
Cart.com says it will use the capital to scale its logistics network, expand AI capabilities and develop workflow automation tools. Continue reading.

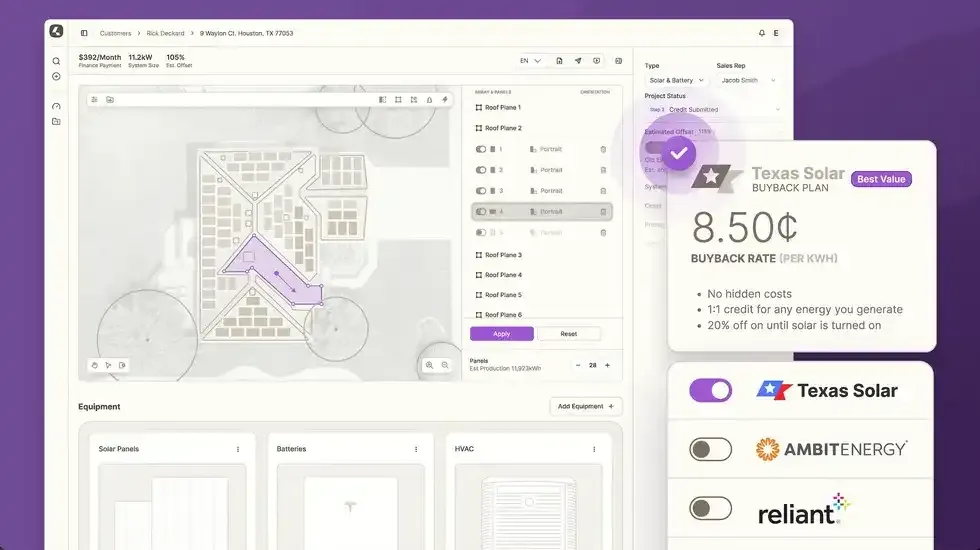
Houston-based Artemis, formerly Monalee, closed its latest funding round in March. Rendering courtesy Artemis.
Houston tech startup Artemis raised $6 million from 10 investors, it reported in March. The company offers an AI-supported platform that enables solar, battery storage and home improvement contractors to design, sell and finance energy projects.
Long Journey and Copec WIND Ventures co-led the round, with participation from angel investor Scott Banister, Coalition Operators, FJ Labs, Ludlow Ventures, Palm Tree Crew, Plug and Play Ventures, Shrug Capital and Tribeca Ventures.
To help propel growth, the company secured $10 million in financing last year (under its previous name, Monalee) from venture debt and growth credit provider Applied Real Intelligence. As Monalee, the company raised $16 million in venture capital. Continue reading.

Helix Earth's technology is estimated to save up to half of the net energy used in commercial air conditioning, reducing both emissions and costs for operators. Photo via Getty Images
Houston-based Helix Earth Technologies closed a $12 million Seed 2 funding round to scale manufacturing of its energy-efficient commercial HVAC add-on technology in April.
Veriten, a Houston-based energy investment firm, led the round. Rua Ventures, Carnrite Ventures, Skywriter LLC and Textbook Ventures also participated.
Helix Earth—which was founded based on NASA technology, spun out of Rice University and has been incubated at Greentown Labs—is developing high-efficiency retrofit dehumidification systems that aim to reduce the energy consumption of commercial HVAC units. The company reports that its technology can lead to "healthier indoor air, lower energy bills, reduced building maintenance, and more comfortable spaces for building owners and occupants." Continue reading.
The company has developed thermal insulation technology that improves efficiency and safety in buildings and outdoor infrastructure. Photo via LinkedIn
Houston-based NanoTech Materials closed a $29.4 million Series A in April.
The round was led by Austin-based HPI Real Estate & Investments. Houston-based Goose Capital and Austin-based Milliken & Company also participated.
Nanotech has developed its patented Insulative Ceramic Particle (ICP) technology, which reduces heat transfer in buildings and outdoor infrastructure, improving efficiency and safety. It's known for its Cool Roof Coat, Wildfire Shield and Insulative Coat: Cool Touch product lines. Continue reading.
Paige founder and CEO Emily Cisek. Photo courtesy Paige
Houston-based Paige, a comprehensive life planning and succession software company, secured a $2.5 million investment to expand the AI-driven tools on its platform this spring.
The funding comes from Alabama-based 22nd State Banking Company, according to a news release. Paige says it will use the funding to expand automation, AI-driven onboarding and self-service tools, as well as add to its sales and customer success teams.
The company was originally founded by CEO Emily Cisek in 2020 as The Postage and rebranded to Paige last year. It helps users navigate and organize end-of-life planning with features like document storage and organization, password management, and funeral and last wishes planning. Continue reading.

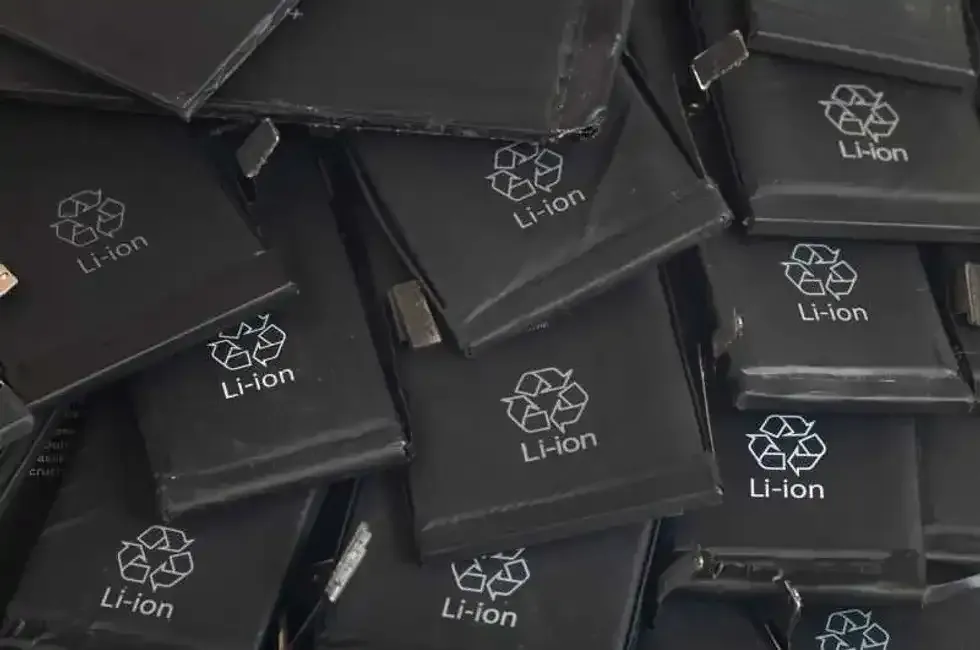
The company plans to use the funds to support its flagship Texas facility and planned merger. Photo via LinkedIn
Houston-based Ace Green Recycling raised $32 million in private investment in public equity (PIPE) financing to support its future plans for growth, the company reported in May.
The battery recycling technology company secured the financing with Athena Technology Acquisition Corp. II, a publicly traded special purpose acquisition company that Ace previously announced it plans to merge with. Once the merger is completed, Ace will become a publicly traded company on the Nasdaq Stock Exchange under the ticker symbol "AGXI."
Ace says the financing will be used to complete the merger and scale the company. Continue reading.

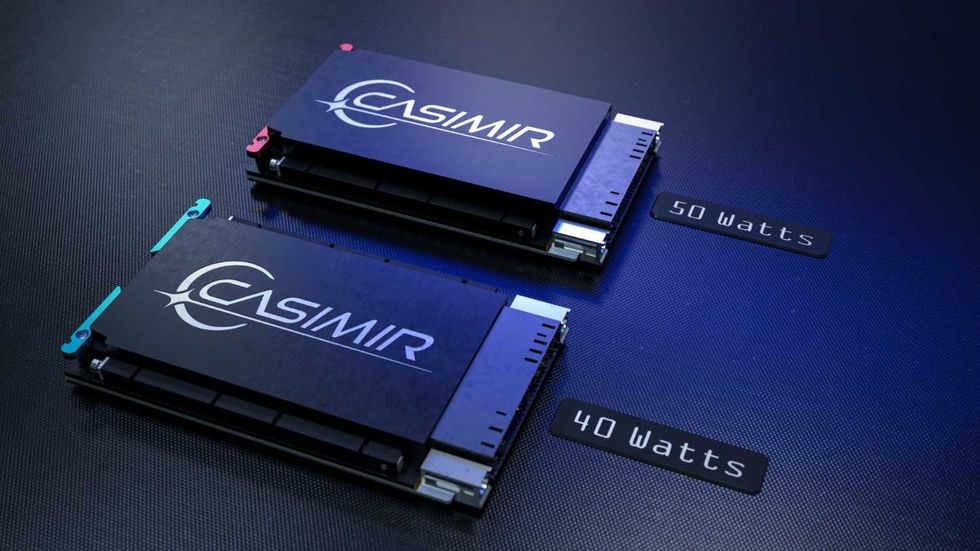
Casimir’s semiconductor chips can generate power from quantum vacuum fields without the need for batteries or charging. Photo via casimir.inc
Houston-based Casimir emerged from stealth in May with a $12 million seed round to commercialize its quantum energy chip.
The round was led by Austin-based Scout Ventures. Lavrock Ventures, Cottonwood Technology, Capital Factory, American Deep Tech, and Tim Draper of Draper Associates also participated in the round. The oversubscribed round exceeded the company’s original $8 million target, according to a news release.
Casimir’s semiconductor chips can generate power from quantum vacuum fields without the need for batteries or charging. The company plans to commercialize its first-generation MicroSparc chip by 2028. Continue reading.

VoltaGrid has developed a modular power generation system that improves reliability and limits emissions. Photo via voltagrid.com
Houston-based power generation startup VoltaGrid nailed down a $1 billion equity investment from asset management heavyweight Blackstone and Houston-based oilfield services provider Halliburton in May.
The investment came in two forms:
- A $775 million primary capital raise
- A $225 million secondary capital purchase from existing investors
VoltaGrid, founded in 2020, provides behind-the-meter mobile power generation equipment for data centers, microgrids and industrial customers. Continue reading.

Babur Ozden is the founder and CEO of Aquanta Vision. Photo via LinkedIn
Houston climatech startup Aquanta Vision secured pre-seed funding to accelerate the commercialization of its methane leak detection software, the company announced in May.
EIC Rose Rock participated in the round, joining investors like Marathon Petroleum Corporation, Chevron Technology Ventures, Ecosphere Ventures, and Odyssey Energy Advisors. The investment follows successful field trials for Aquanta Vision’s optical gas imaging (OGI) detection software, according to the company. Continue reading.

Axiom Space closed an oversubscribed $525 million round in June. Image via NASA
Axiom Space tacked on an additional $175 million to a previously announced capital raise in June, bringing the oversubscribed round to a total of more than $525 million.
Axiom shared in February that it had secured $350 million in a financing round led by Type One Ventures and Qatar Investment Authority. In June, the company reported that Japan-based MUFG Bank Ltd. joined the round as a new investor, in addition to continued participation from existing backers.
The funding will go toward developing the company's commercial space station, known as Axiom Station, and the production of its Axiom Extravehicular Mobility Unit (AxEMU) under its NASA spacesuit contract. Continue reading.

The company's platform makes it easier to buy and trade hard-to-access and less traditional assets. File photo
Houston-based fintech company Receipts Depositary Corporation closed a $7 million oversubscribed funding round in June and plans to scale.
The round was led by Austin-based LiveOak Ventures, with participation from Hivemind Capital, Onigiri Capital, OTC Markets Group, GTS, and Redbeard Ventures, according to a release from RDC.
RDC's platform issues depositary receipts (DRs) to qualified investors on digital and alternative assets, making it easier for investors to buy and trade hard-to-access and less traditional assets. Continue reading.


 Houston biotech co. raises $11M to advance ALS drug development